All 218 F&O stocks
Every NSE F&O stock now has its own live tape: footprint, delta, CVD, zones and the Flow Screener, with 30 days of 1-minute history from day one. The list follows NSE's F&O changes on its own.
Footprint, delta, CVD, DOM and liquidity for Nifty, Bank Nifty, Sensex, FinNifty, the NIFTY & SENSEX futures, all 218 F&O stocks and MCX futures — built from live market data from your own broker account, in one app. GEX & dealer-gamma overlays on indices, stocks and futures.
order flow panels on one tape
indices: Nifty, Bank Nifty, FinNifty, Sensex
index futures: NIFTY & SENSEX, their own tape
F&O stocks with their own tape
MCX commodity futures
live bars — the candle moves with every live update
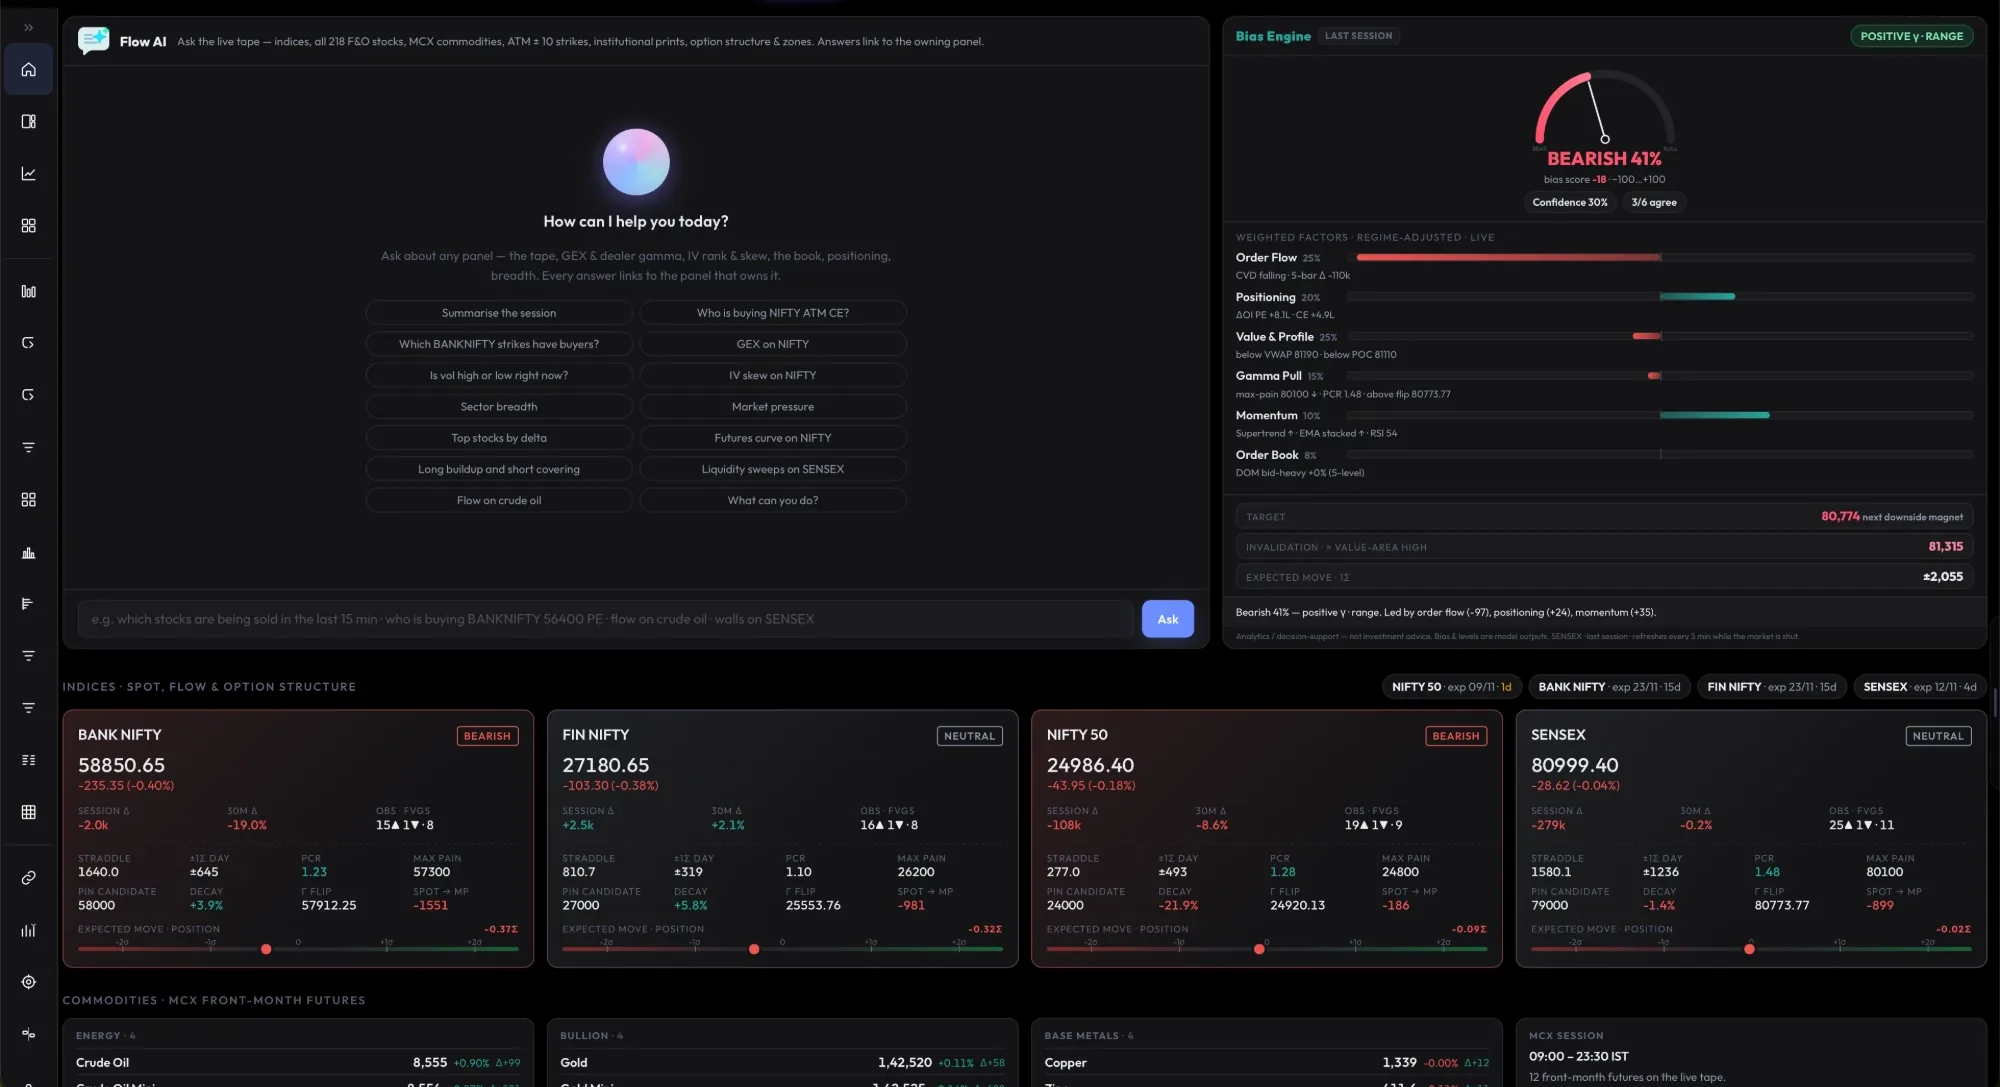
Every image on this page is an unedited capture of OptionAlgo Order Flow on a live NSE session.
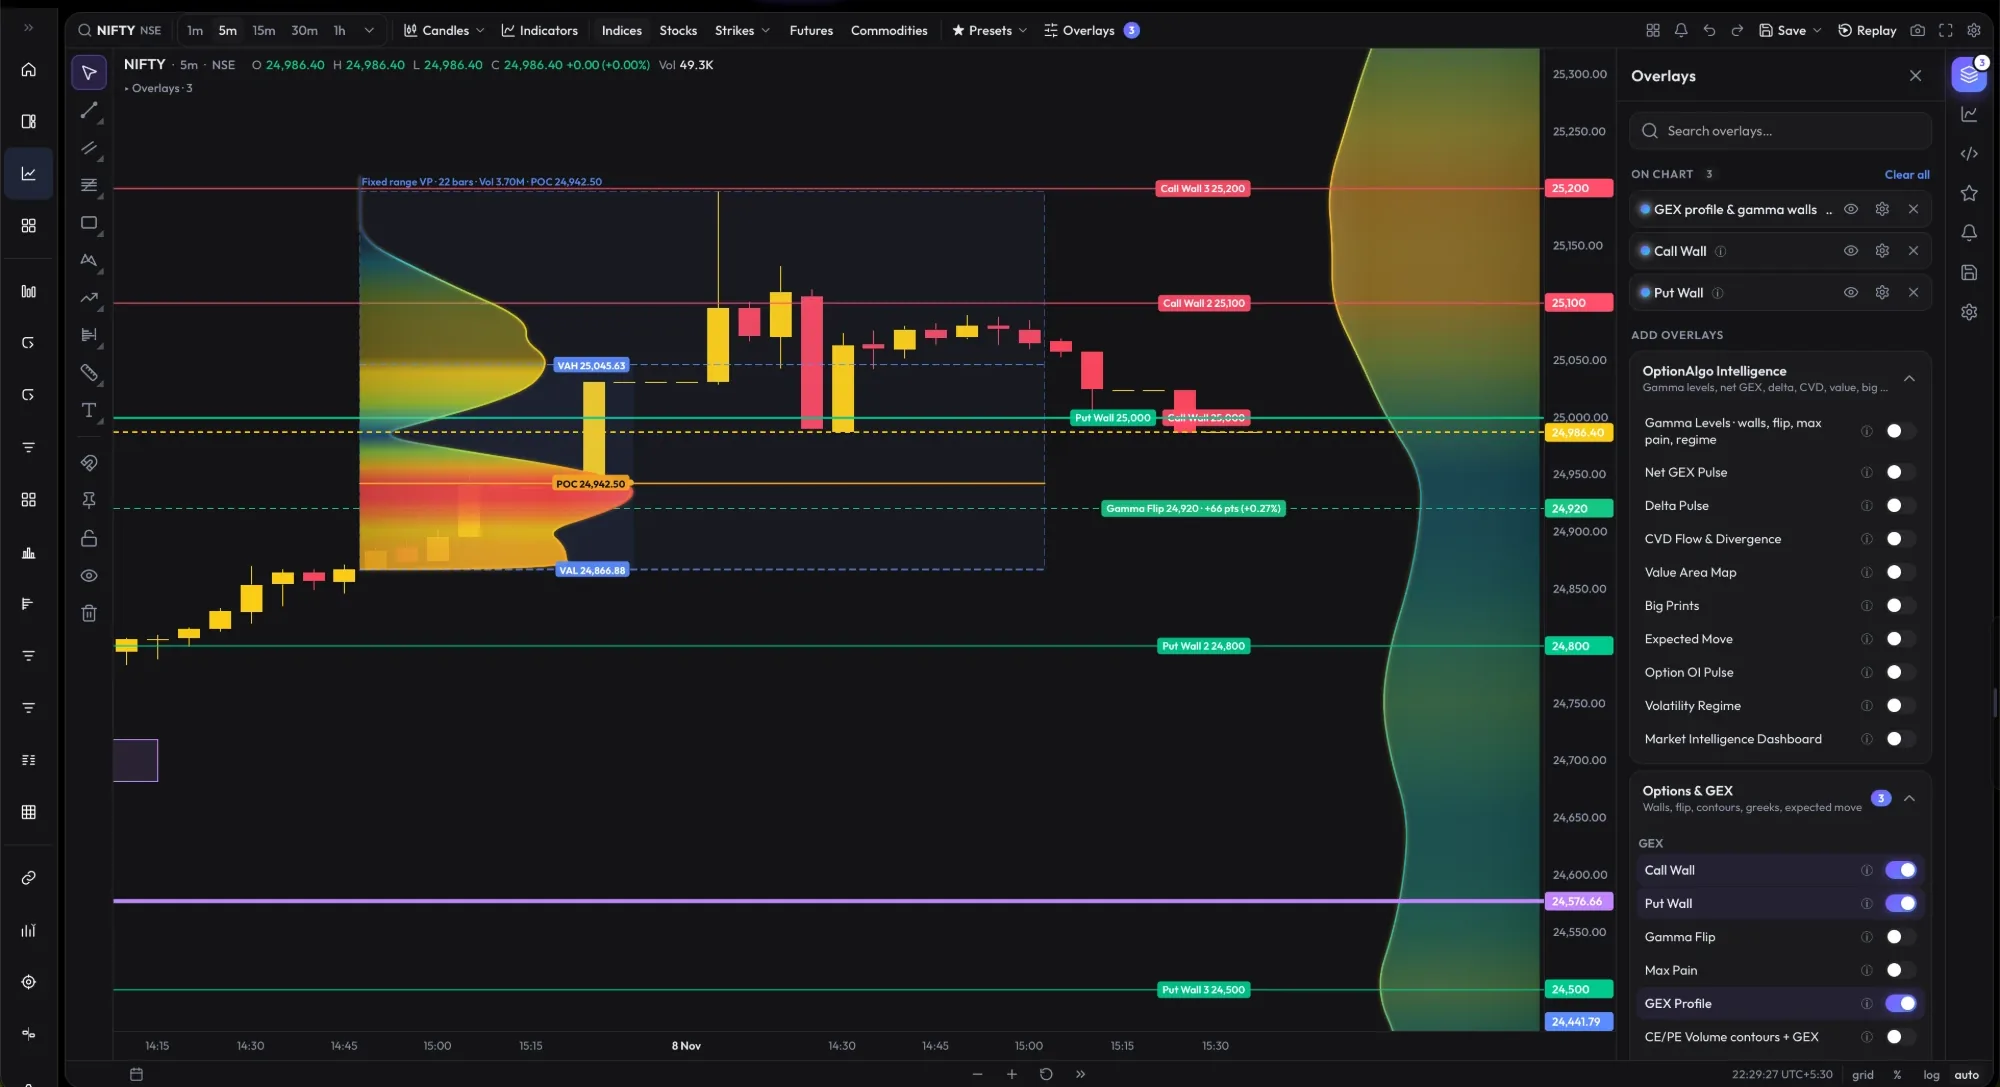
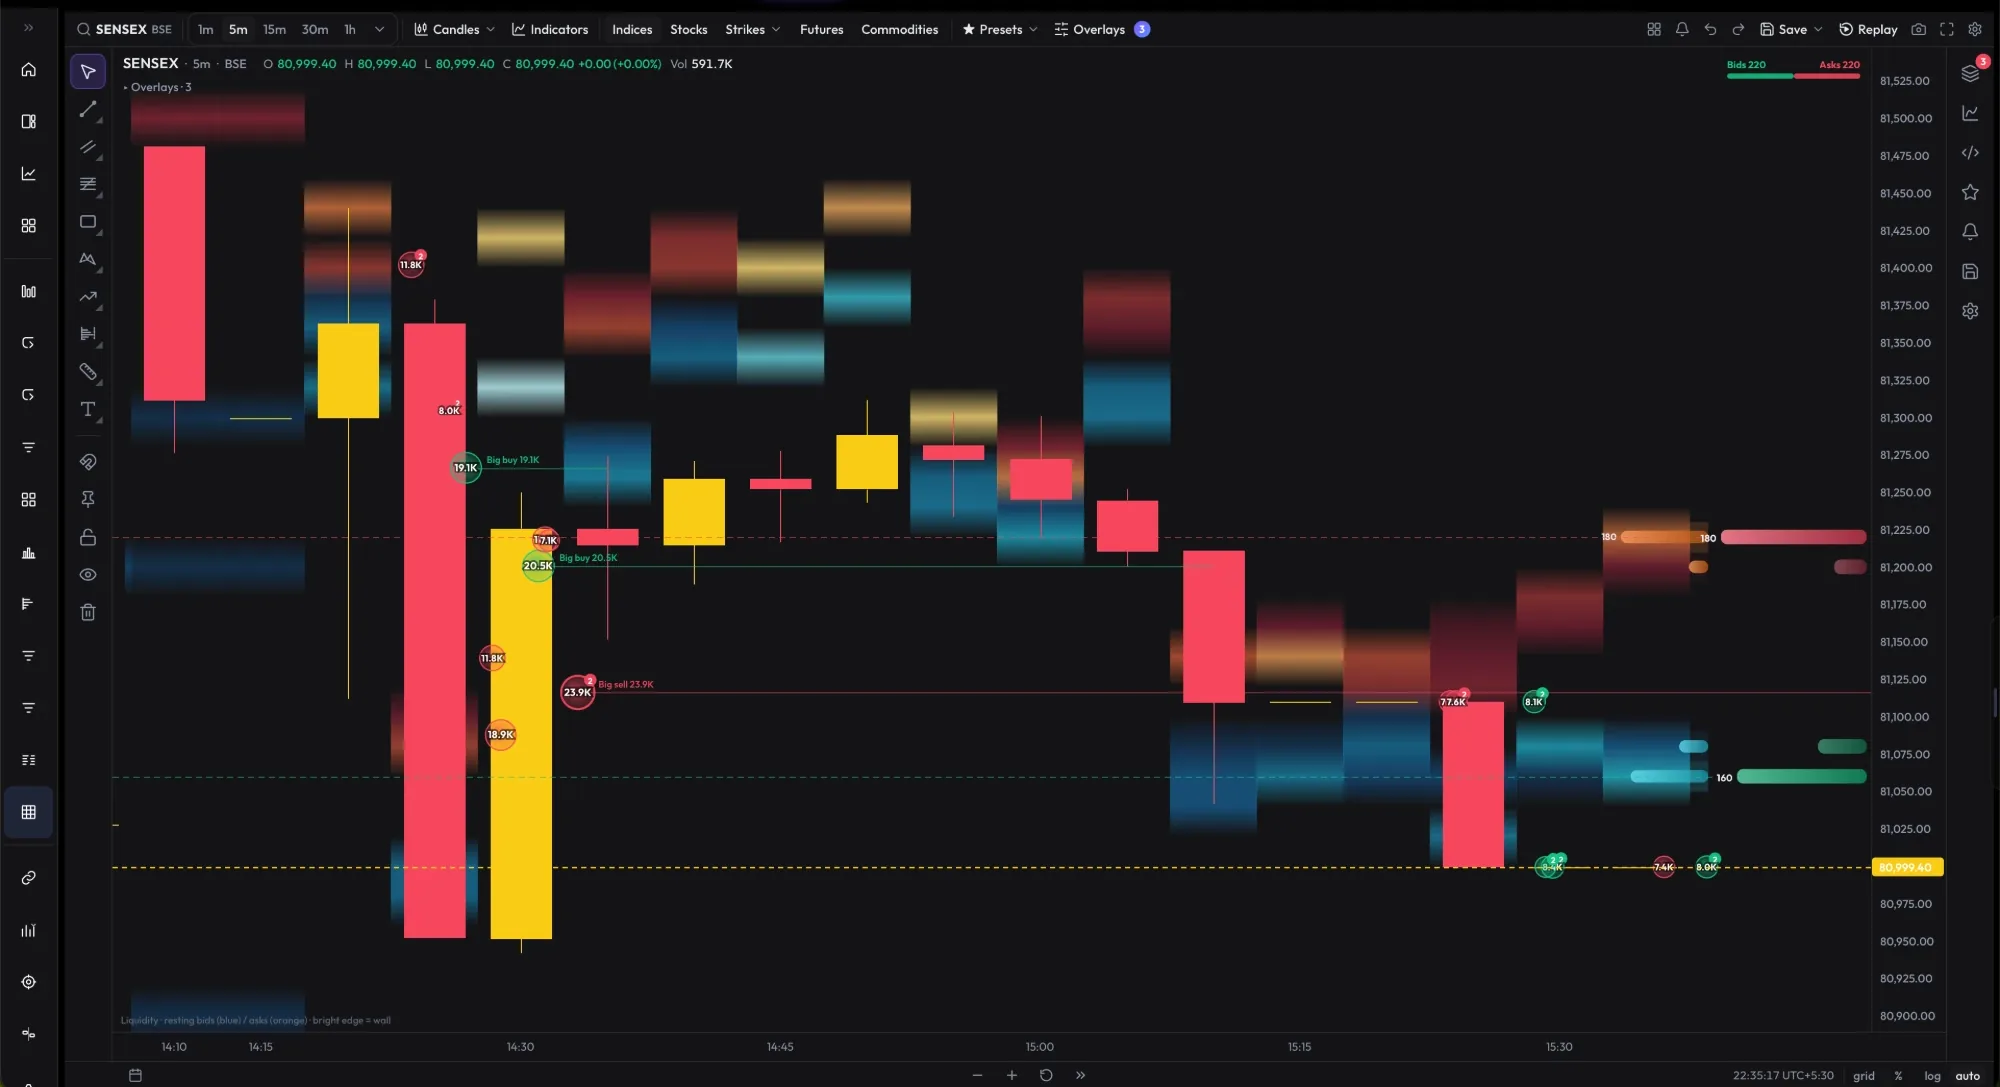
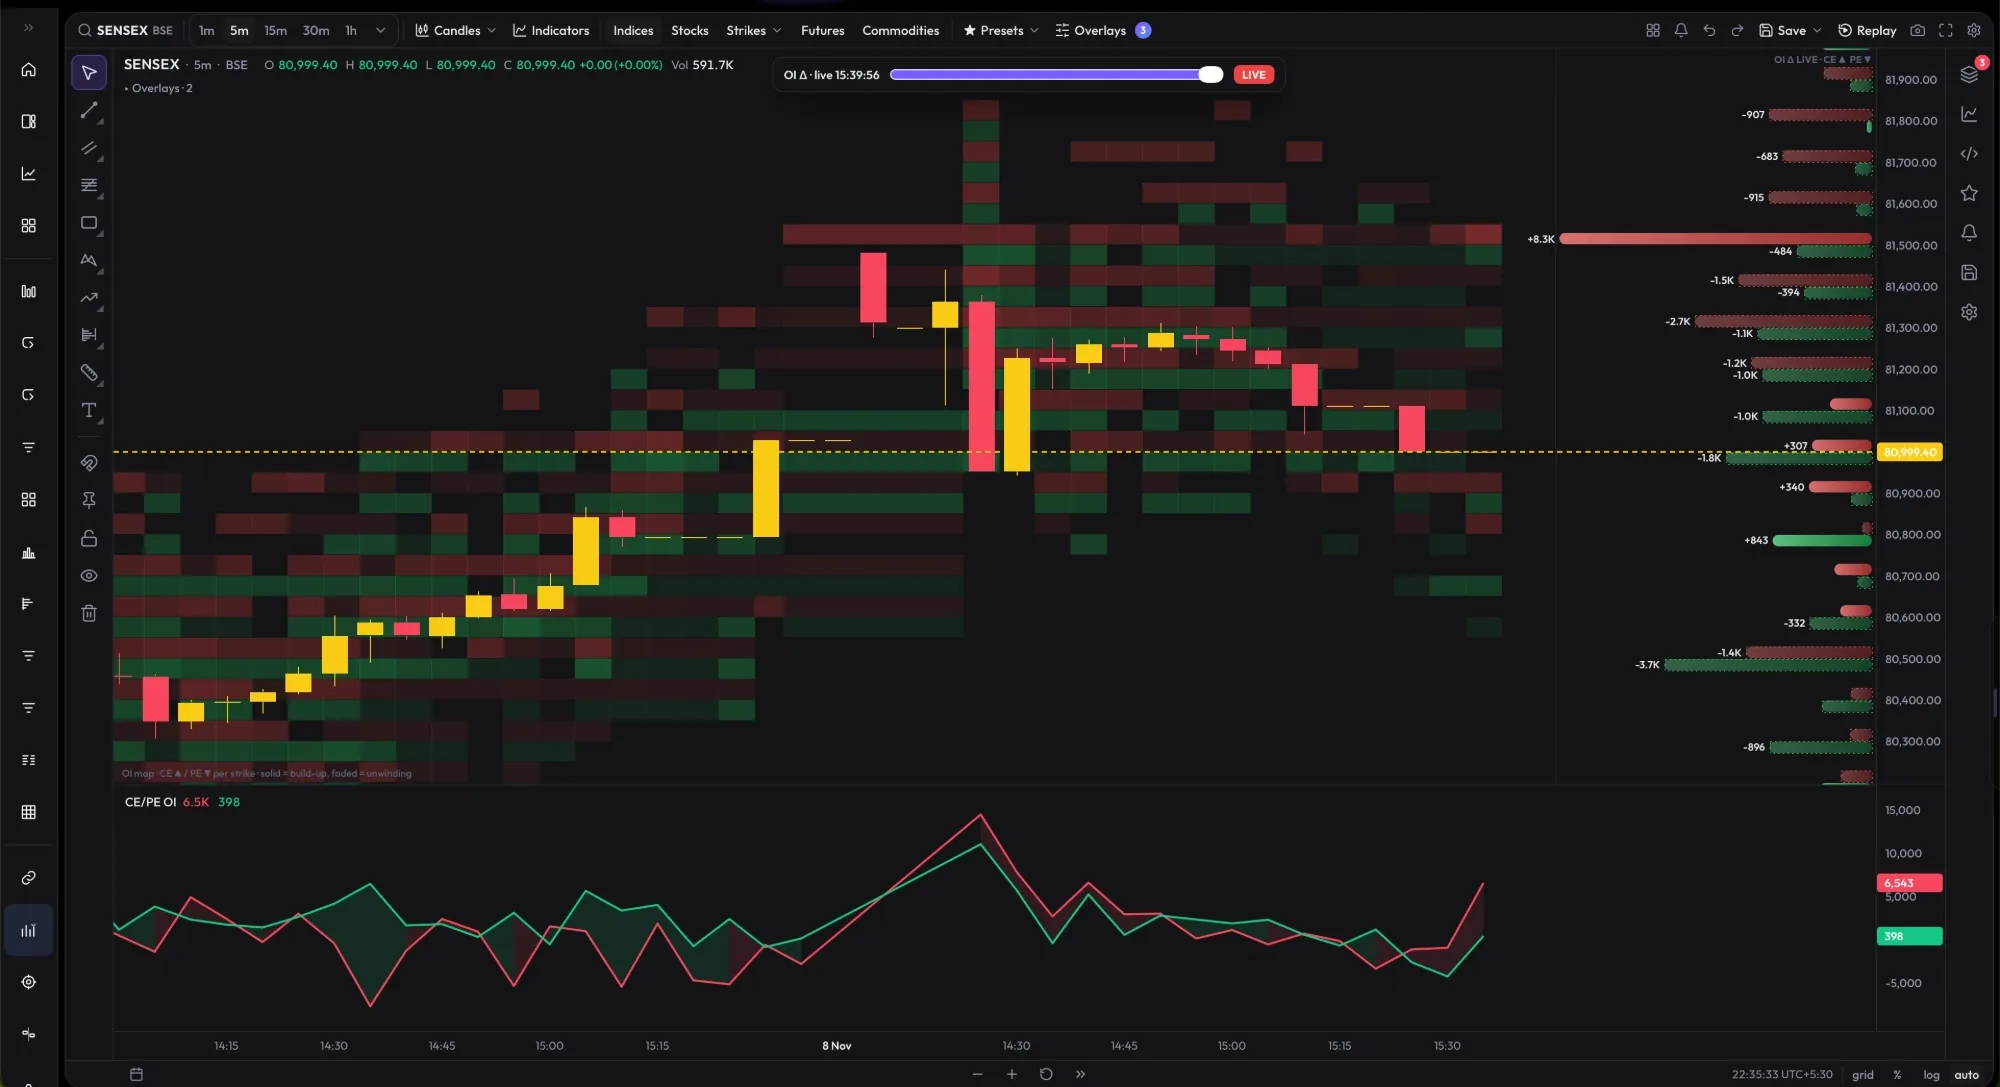
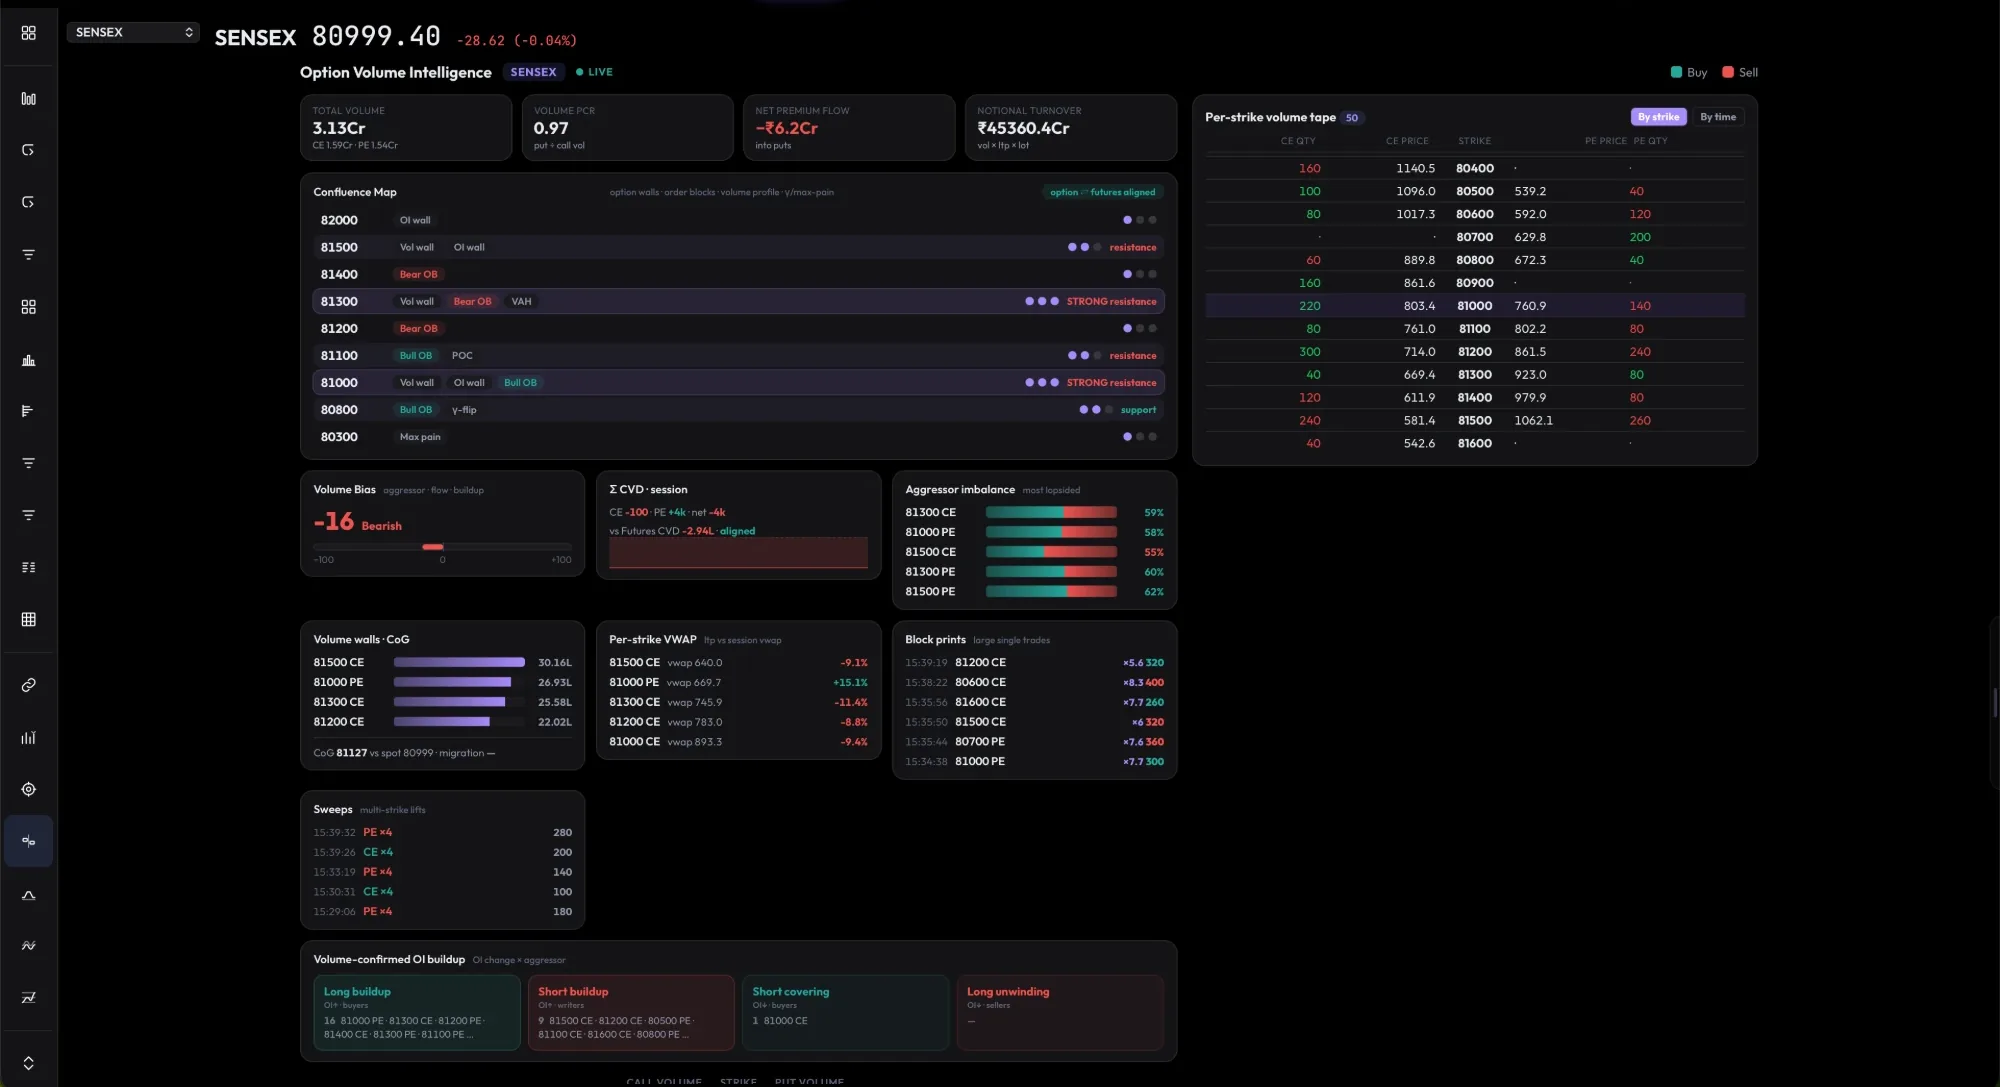
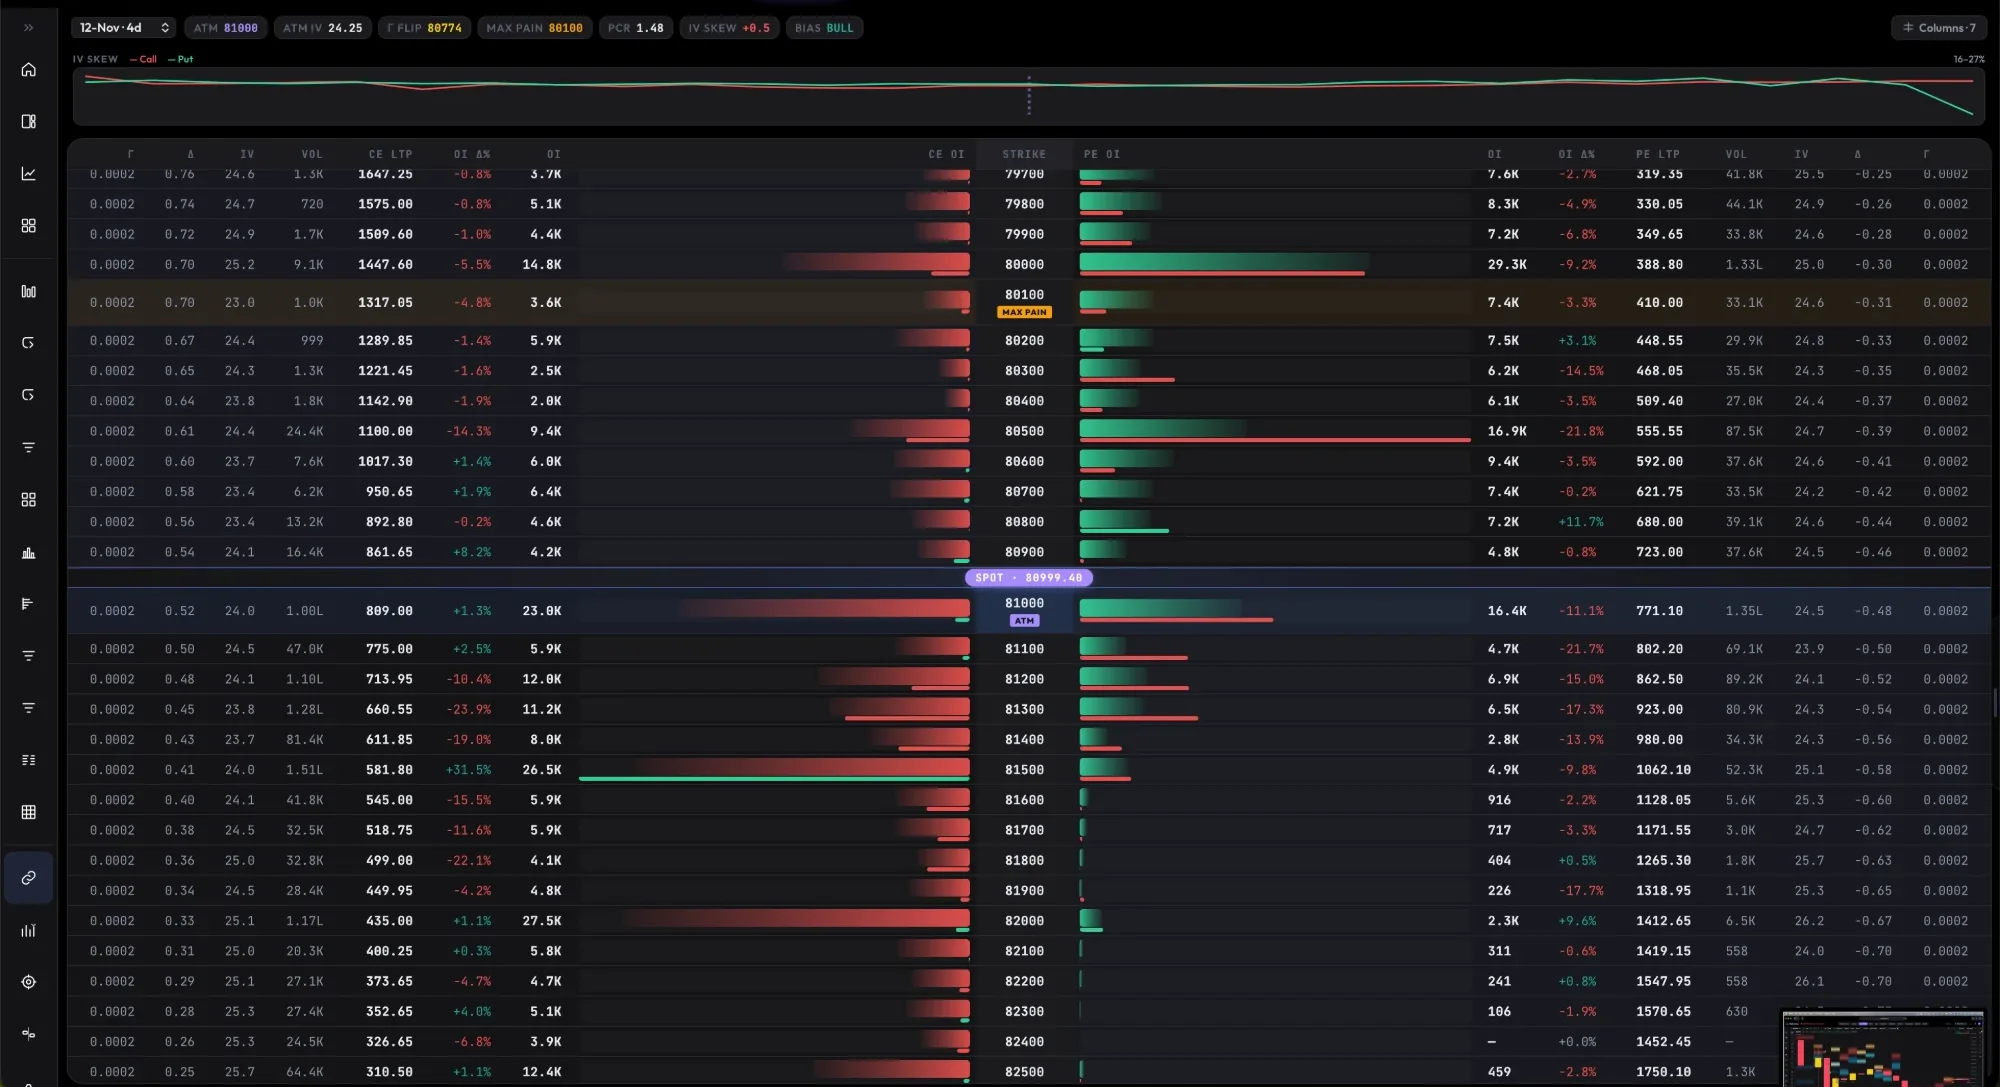
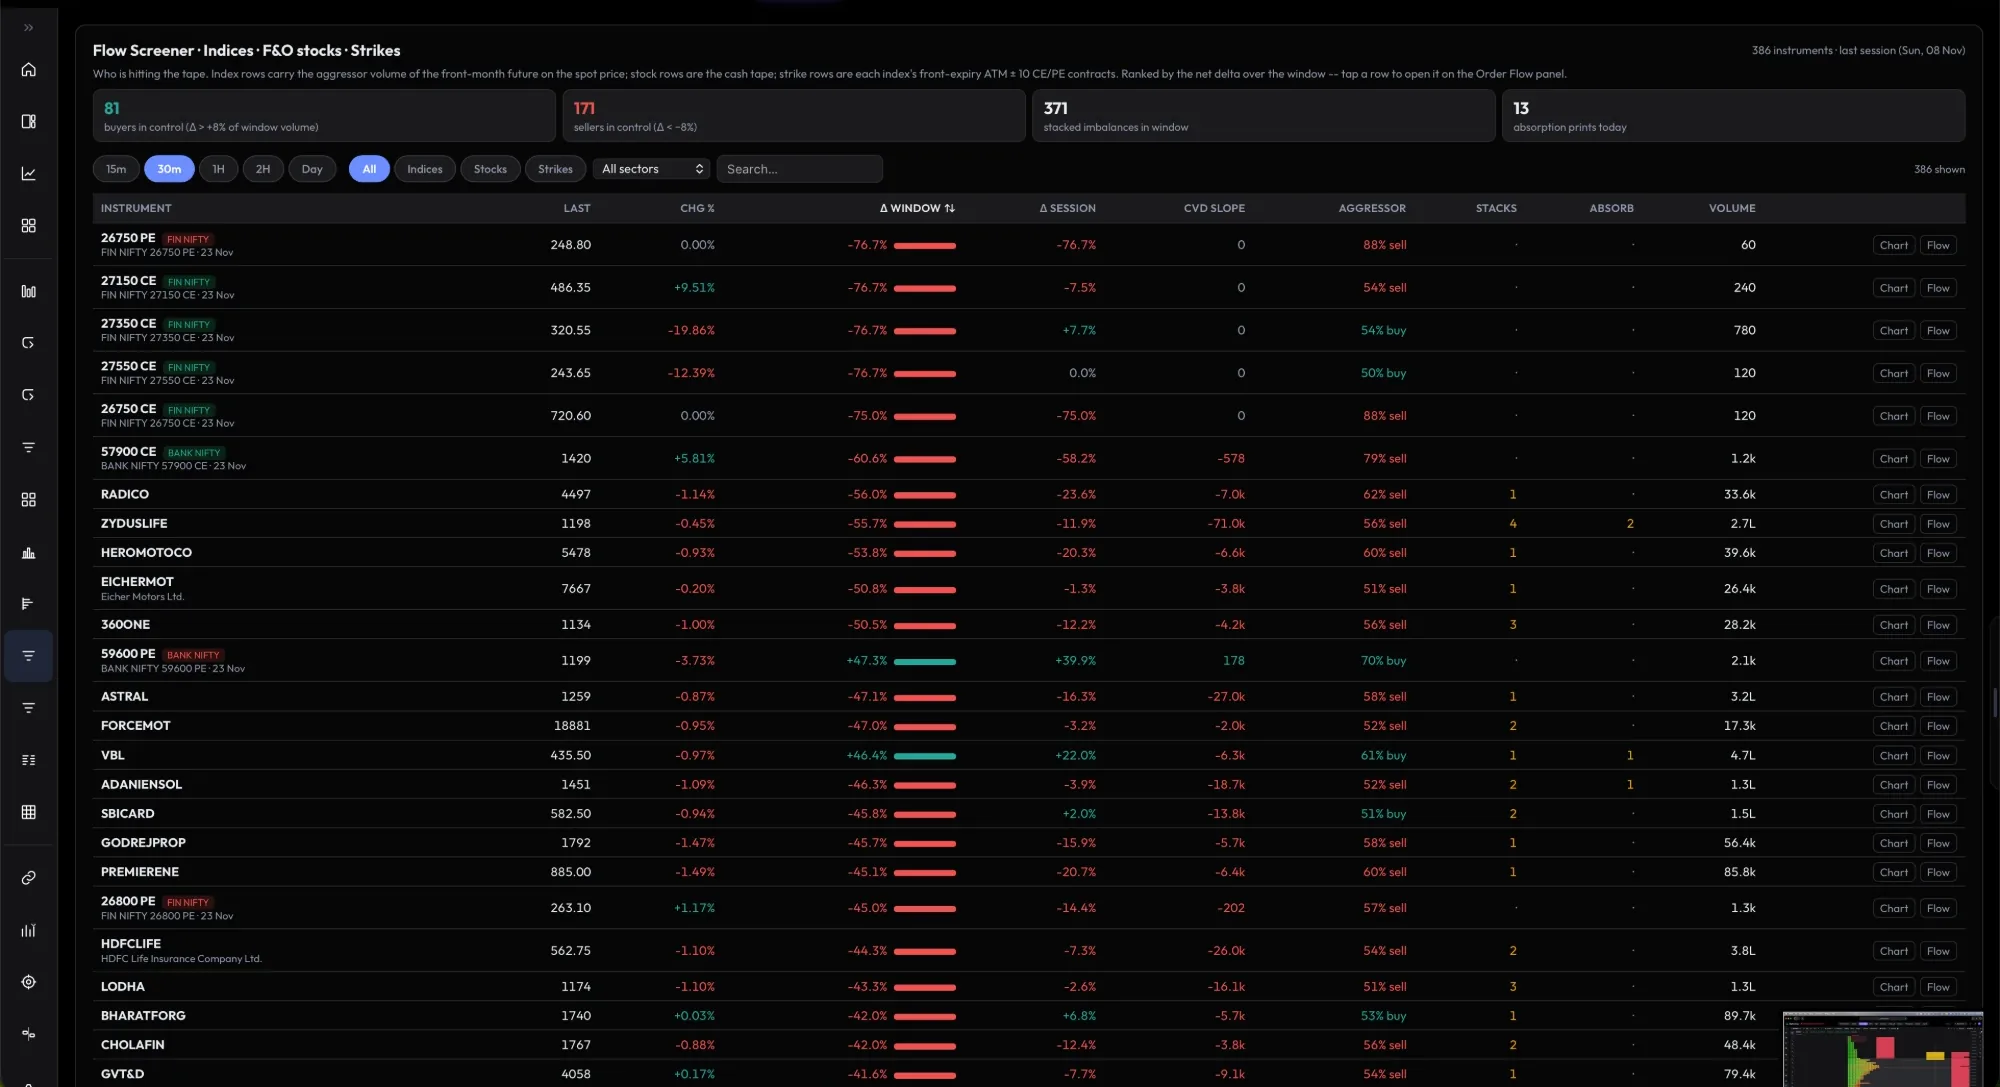
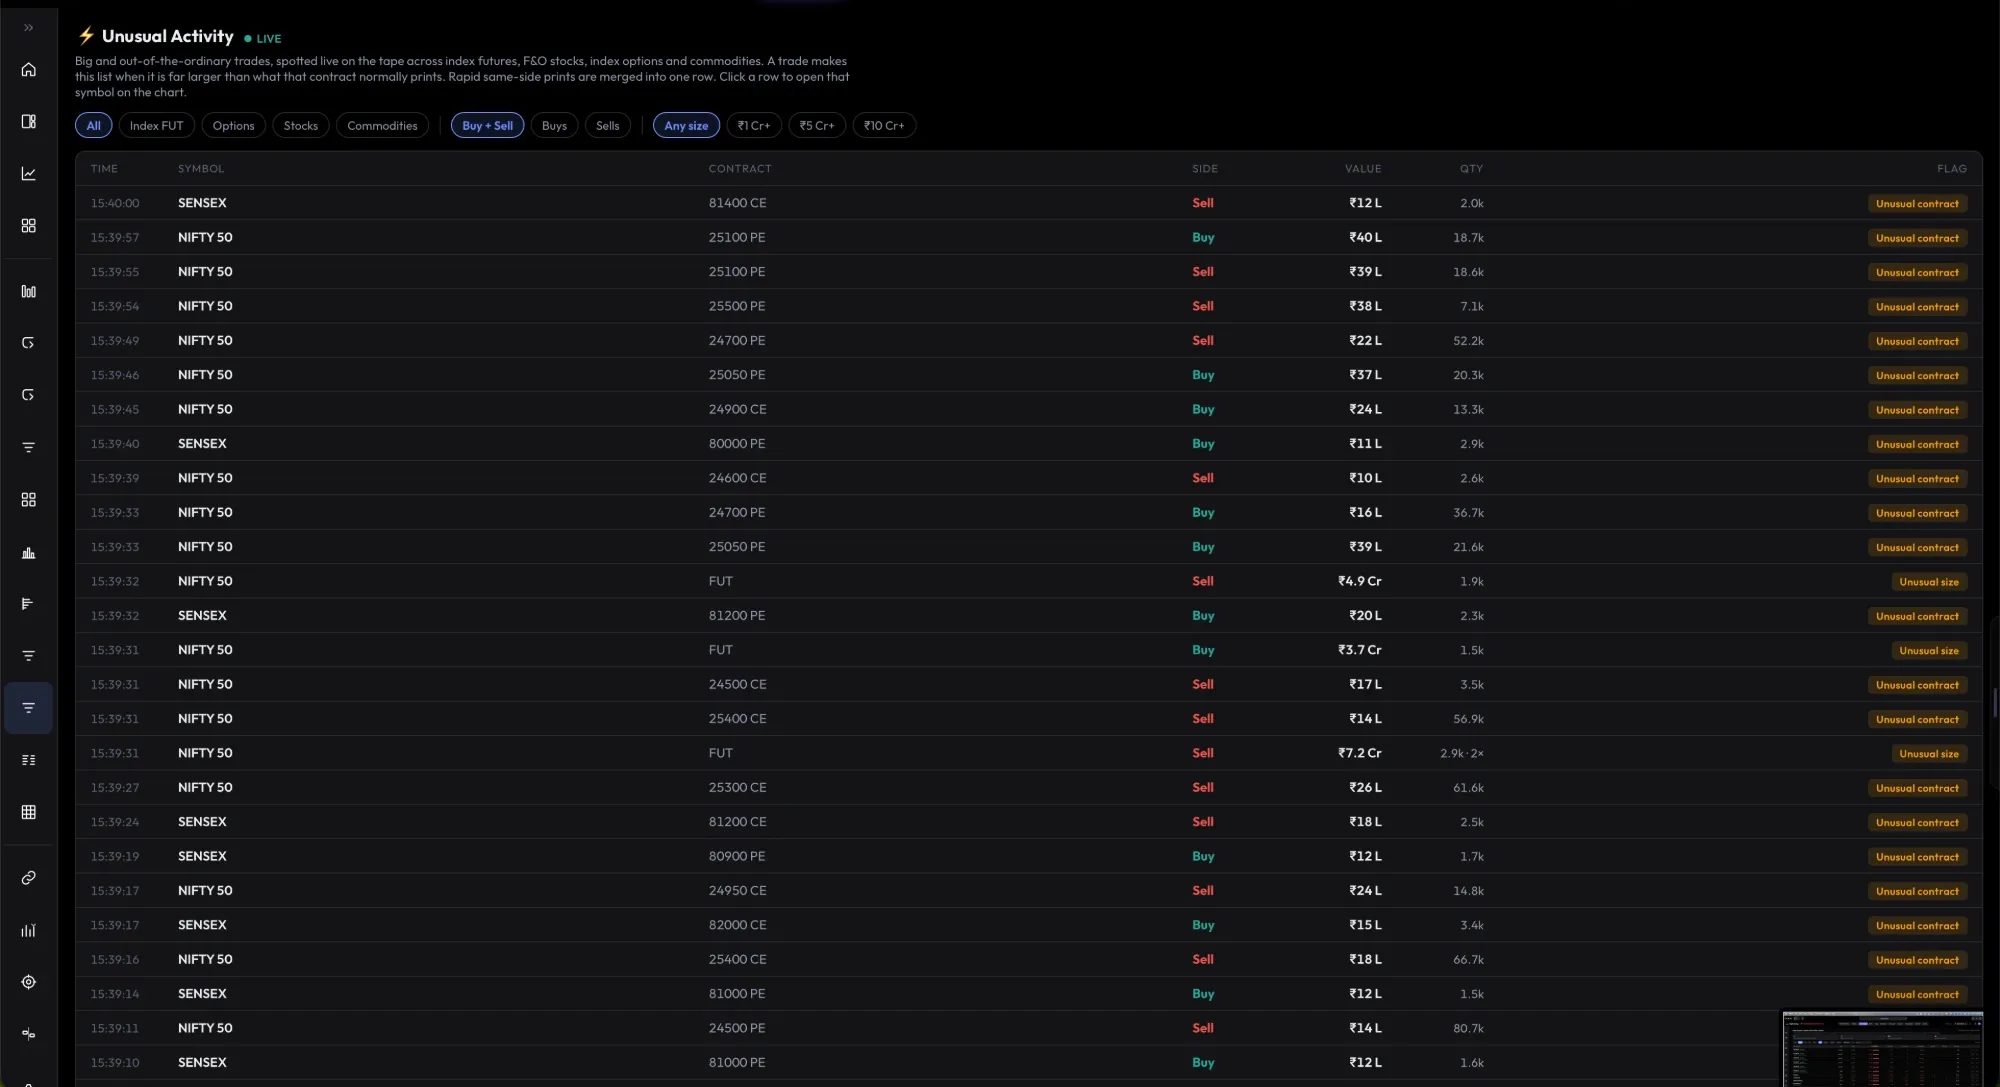
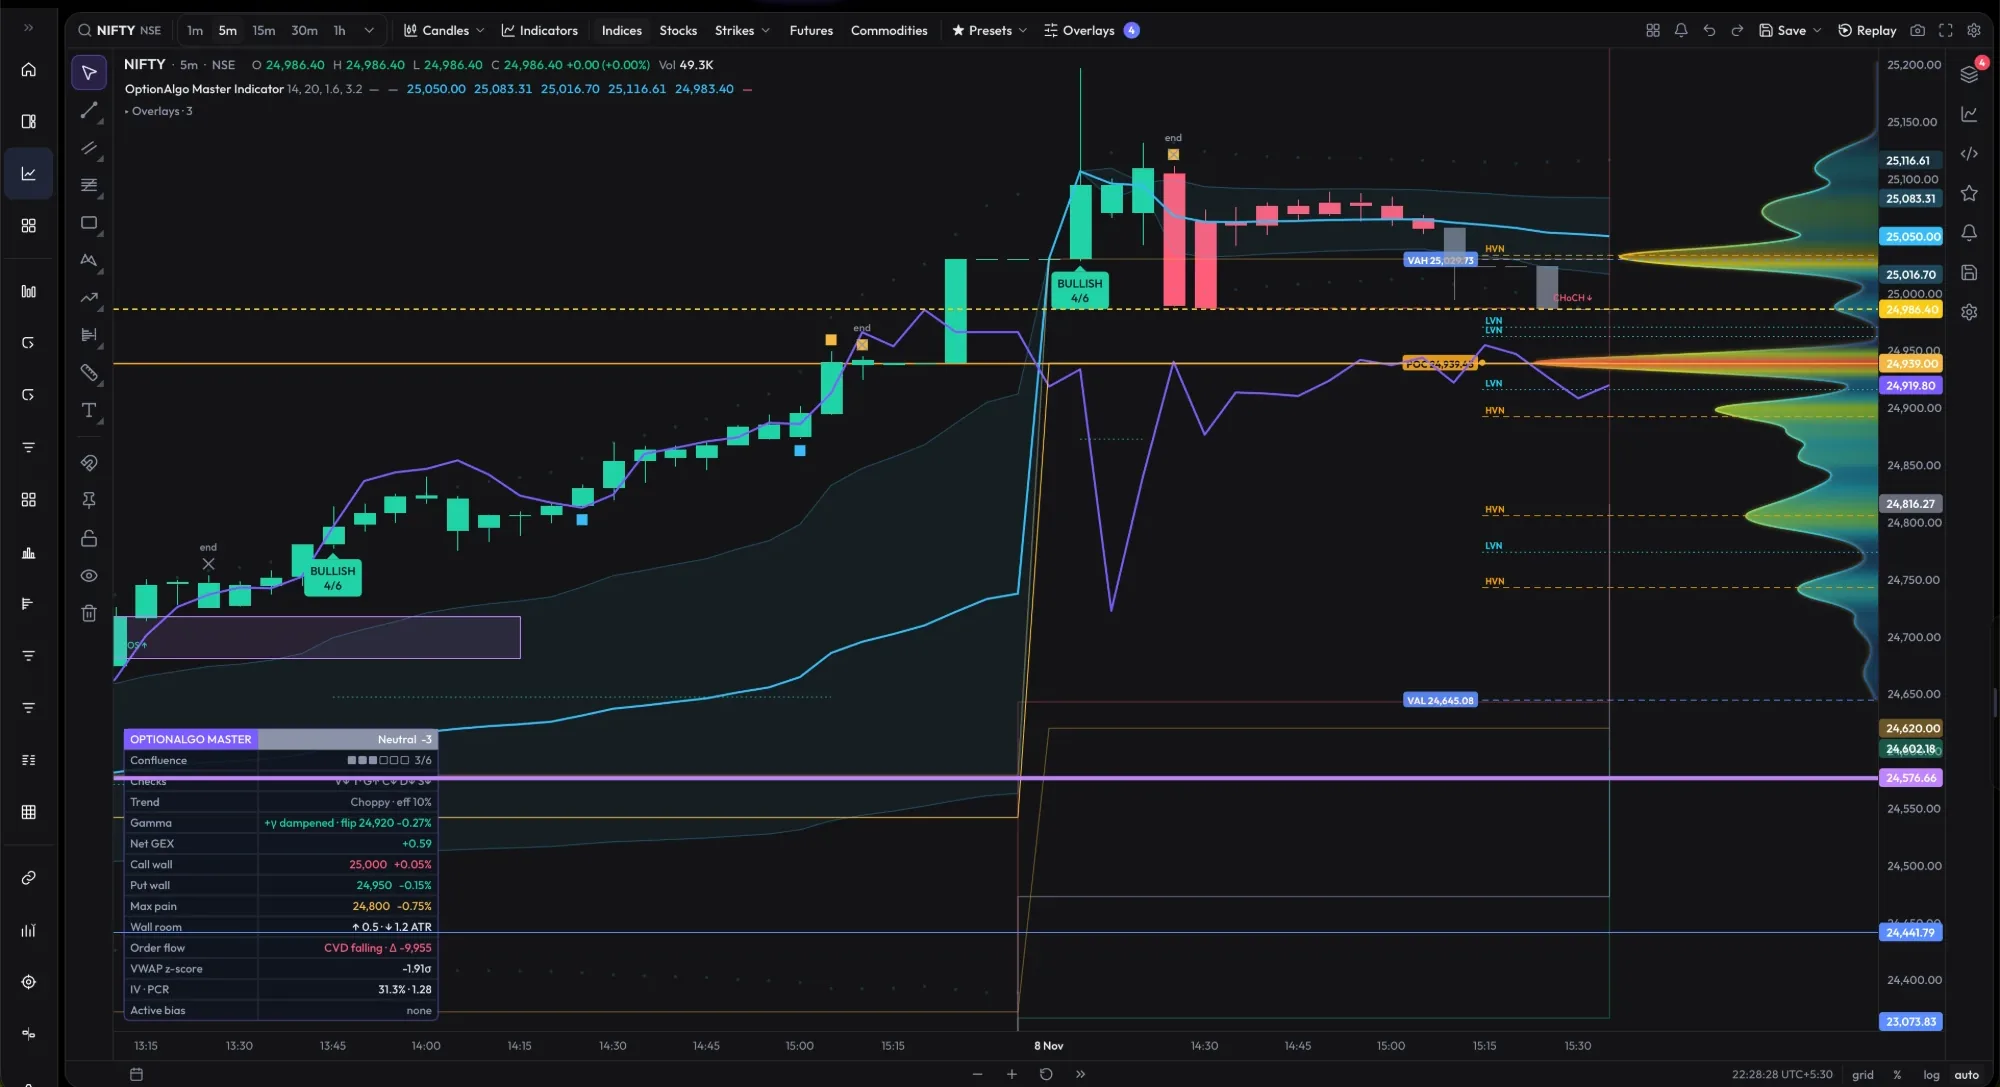
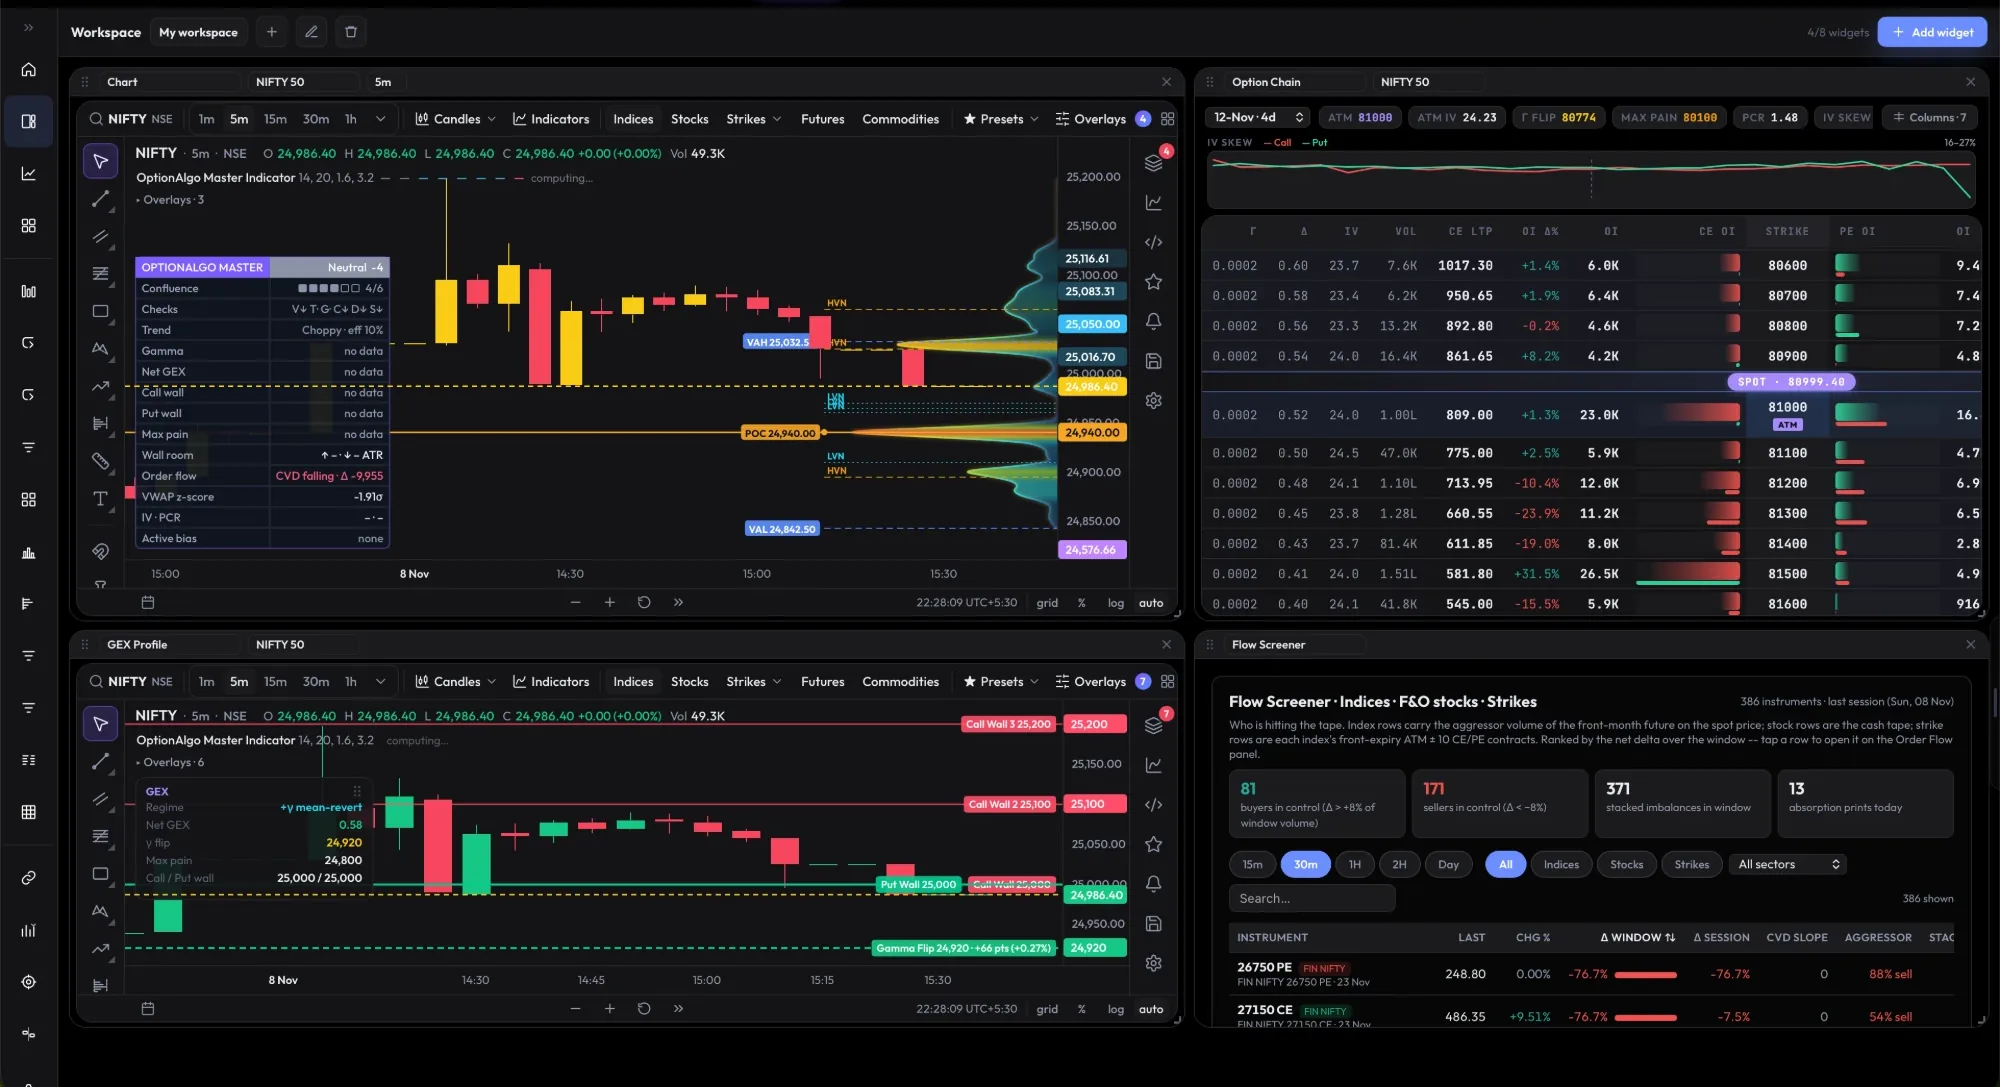
Twenty-four panels that read the same tick tape, so the footprint, the DOM and the option chain always agree.
Every NSE F&O stock now has its own live tape: footprint, delta, CVD, zones and the Flow Screener, with 30 days of 1-minute history from day one. The list follows NSE's F&O changes on its own.
Charts now move on every live update, up to ten times a second, instead of waiting for the next database read. The forming candle and its footprint cells grow in real time.
Footprint charts open with their bid × ask cells already filled, with no bare candles first. Rows now sit exactly on their prices at every zoom, and an optional marker flags unfinished auctions at a bar's high or low.
High and low volume nodes, naked POCs carried forward from earlier sessions until price trades through them, a developing value area, and volume values printed on every row.
Single prints highlighted, poor highs and lows labelled, initial-balance extensions at 1.5× and 2×, and naked session POCs, all built from the TPO letters themselves.
Write your own studies in Pine, Python or JSON and run them on the chart. Every script is checked automatically: unsafe code is blocked and buy/sell wording is rewritten into neutral market language.
Bid × ask volume at every price inside each candle, with delta, imbalance highlights, stacked imbalances and the point of control per bar.
Advanced price chart with gamma flip, call and put walls, anchored VWAP with bands, big-trade bubbles and a full indicator library.
Session and visible-range volume profile with POC, value area high and low, the buy/sell split at every level, HVN / LVN nodes, naked POCs and a developing value area.
Letter-based time-price profile with initial balance and its 1.5× / 2× extensions, single prints, poor highs and lows, naked POCs and value migration from one session to the next.
Auto-detected order blocks, fair-value gaps, liquidity pools and break-of-structure marks on 5 and 15-minute charts.
A synced multi-chart grid for several instruments at once, and session replay to step through any past day bar by bar.
Switch between bid × ask, single-column bid ask, buy/sell volume, delta and percentages. View classified buy/sell feed-update counts and count delta on newly collected data.
Highlight each bar’s point of control, show its marker, extend the level until touched and add a visible-range volume POC. Choose your POC colour in Cluster / POC.
Highlight high-volume rows or show only rows above a selected threshold. Compact chart controls and white sidebar icons on dark themes keep the view easy to scan.
Open Overview, Workspace, Chart and Multi-Chart at the top of the sidebar, followed by Order Flow, GEX and the rest of your analysis panels.
Read volume, delta, delta % and cumulative delta beneath each candle, or open the per-bar table for bid and ask quantities.
Open Maps → OI change · replay on an index chart to see OI changes by strike and scrub through the available session snapshots.
Trade-count modes measure classified positive-volume feed updates, not individual exchange executions. Historical rows without collected side counts display a dash.
Live depth of market with bid and ask sizes, wall detection, and a chain view of ATM ± 5 strikes on a single screen.
Resting orders painted over time, so you can watch liquidity get pulled, stacked or absorbed before price arrives.
Large prints shown as bubbles on the chart, with the size threshold taken from the session's own trade distribution.
Buy vs sell pressure from book imbalance and aggressor flow, scored in one gauge for each index.
Bar delta and cumulative volume delta under the chart to spot divergence between price and real buying or selling.
A feed of unusually large orders on futures and options, tagged by aggressor side.
Option chain across expiries with OI, change, IV and Greeks, centred on ATM and updated live.
Per-strike volume with aggressor side, so you see which calls and puts are being bought or written right now.
Intraday OI build-up by strike — long build-up, short covering, writing and unwinding — with a positioning map.
Dealer gamma by strike, the gamma flip and the walls that tend to pin or accelerate price into expiry.
Implied volatility smile, term structure and a Greeks surface across strikes and expiries.
Days-to-expiry context, straddle-implied expected move and the strikes the market is defending.
Ask in plain English — "where is the call wall?", "flow on crude oil", "which stocks are being bought" — and get an answer from the live panels.
One transparent score from six factors — order flow, positioning, value, gamma, momentum and the book — with every factor shown.
Build your own alerts on 30 metrics — delta, CVD, OI change, walls, imbalance — evaluated on the server, not your browser.
Rank all 218 F&O stocks and MCX futures by delta, volume and price move to find where the money is going.
Advance-decline and flow by sector, so you know whether an index move is broad or carried by a few heavyweights.
Futures curve, basis, premium and session statistics in one panel for a quick read before the open.
Footprint, profiles, structure and options — the same session, side by side.
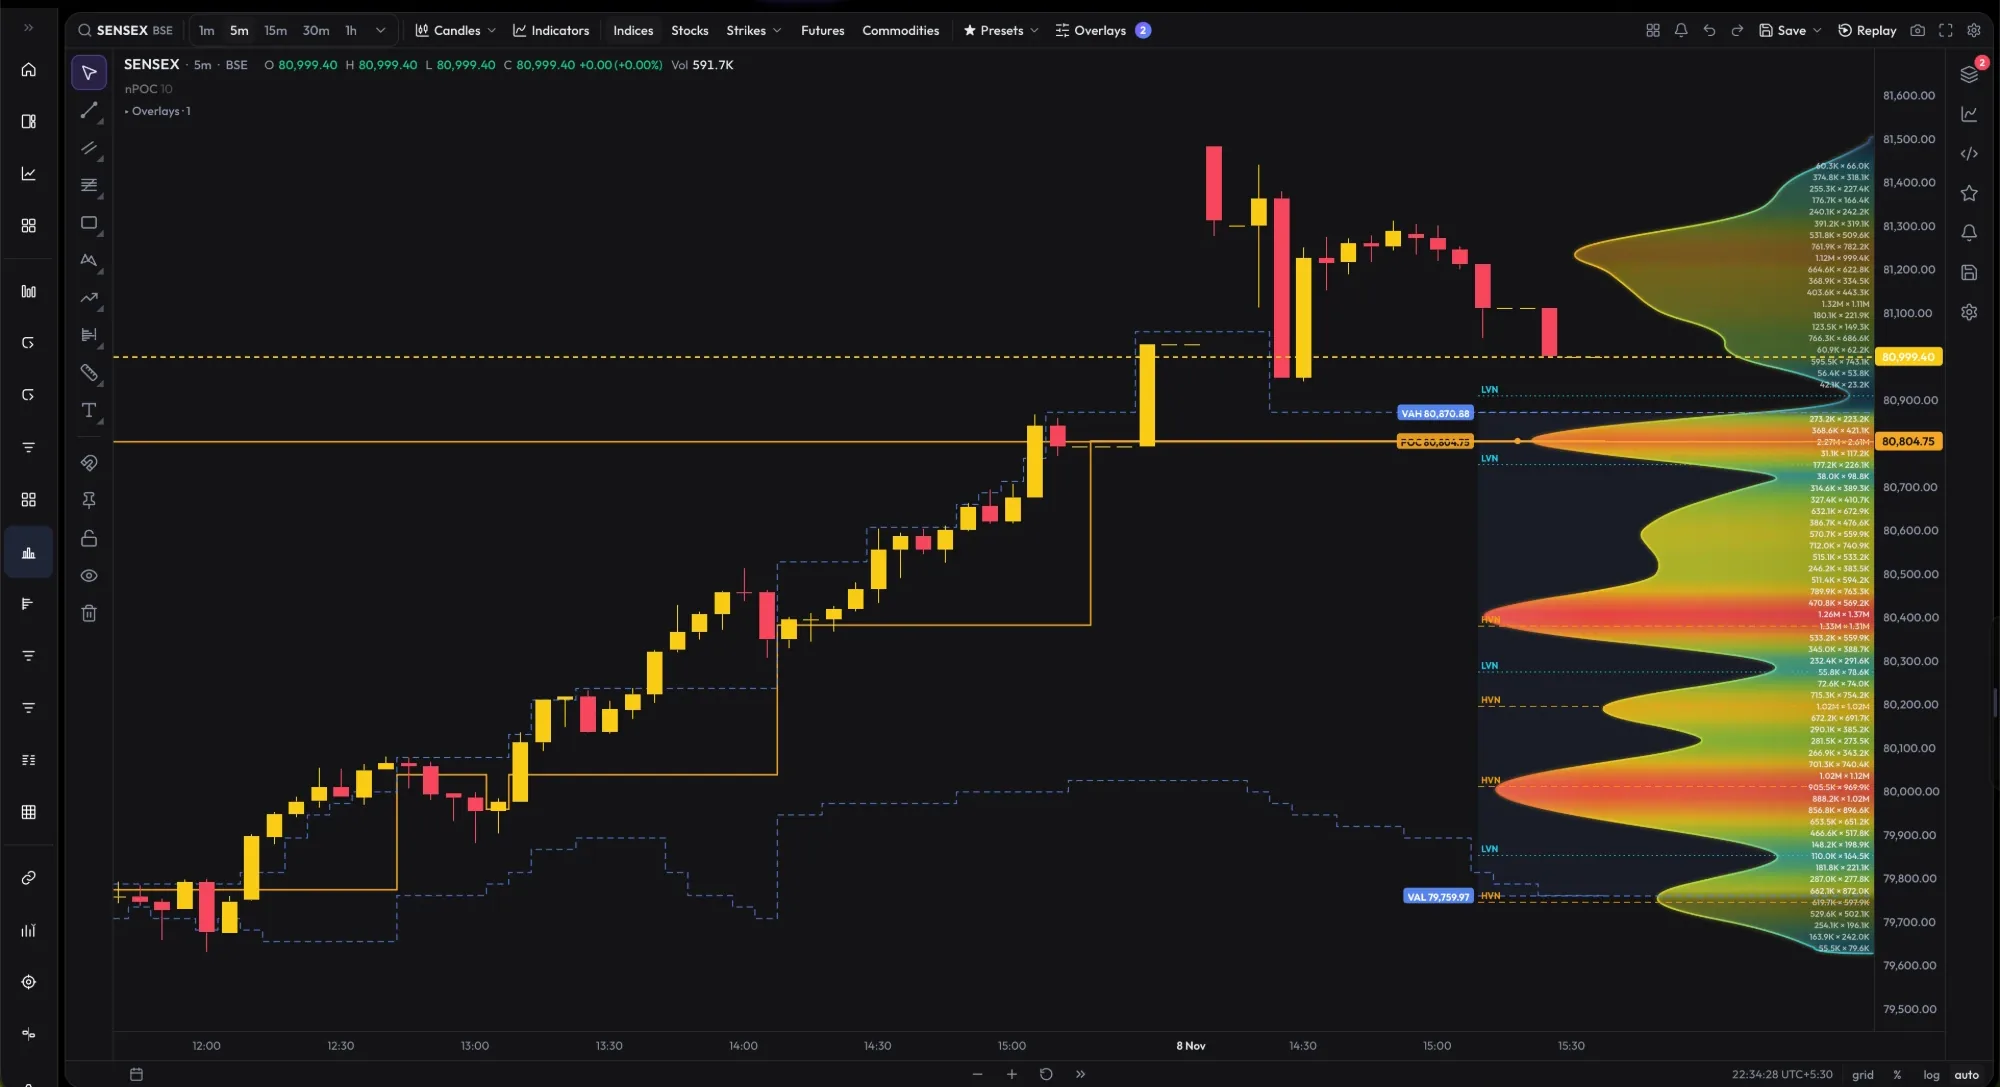
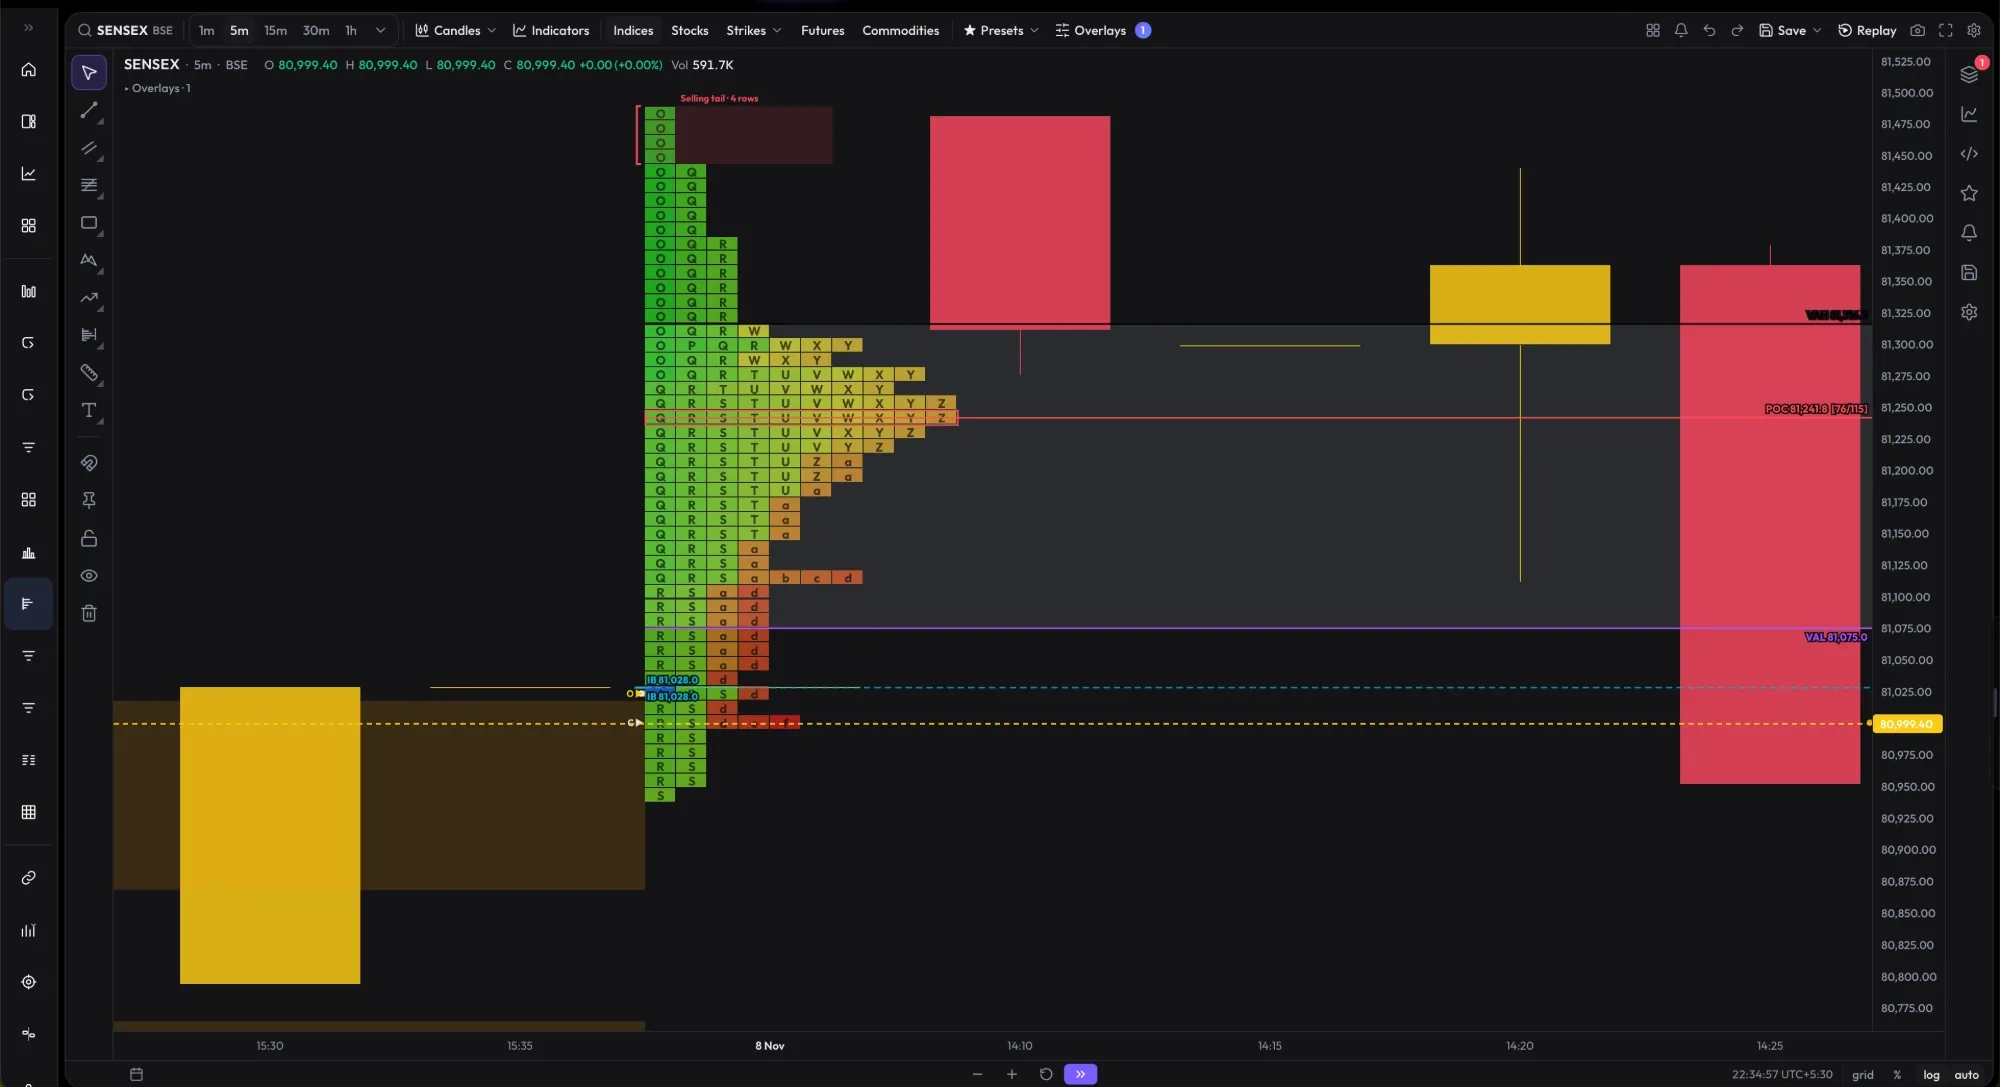
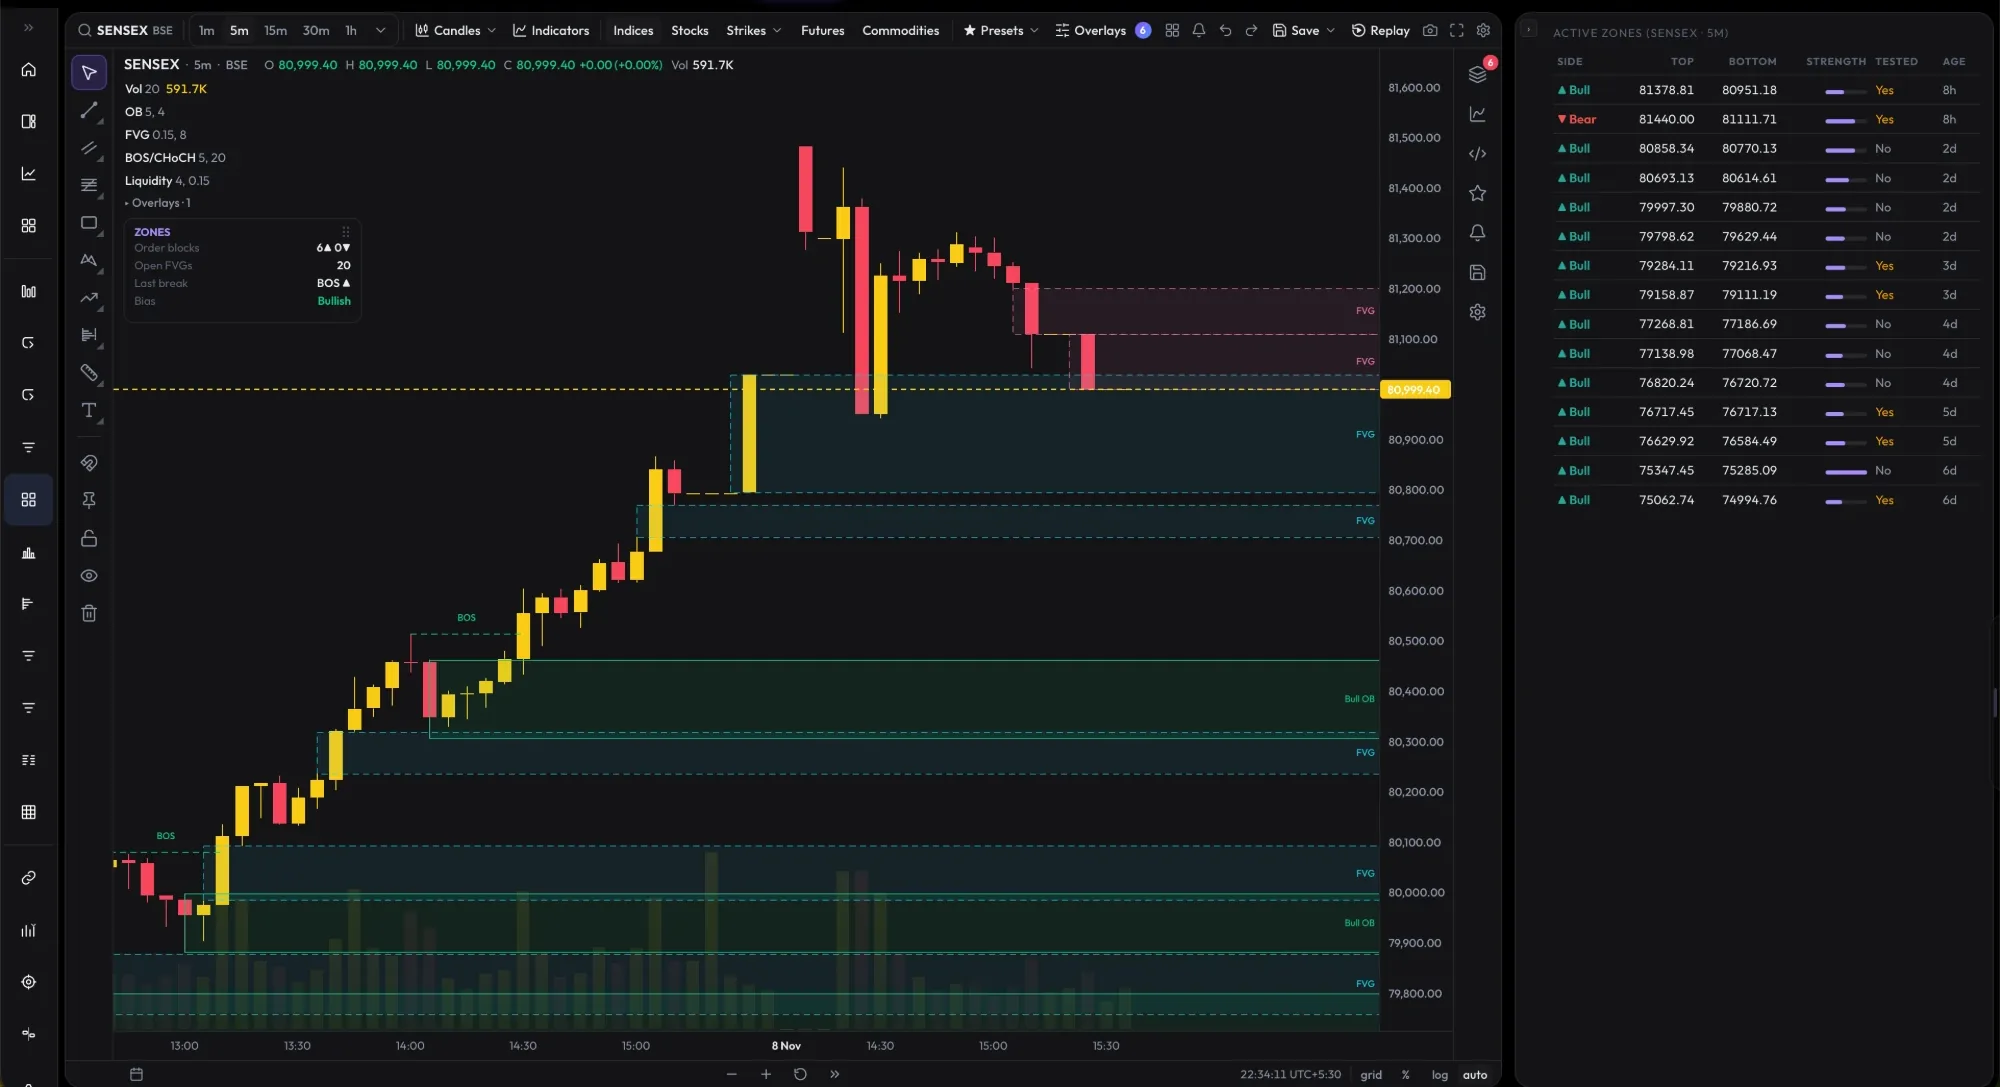

A candle tells you where price went. Order flow tells you who pushed it there.
Every trade on the Nifty futures tape is either a buyer lifting the ask or a seller hitting the bid. Order flow counts those two sides at every price. A normal candle merges them into four numbers; an order flow chart keeps them apart, so you can see whether a rally was driven by aggressive buying or by sellers simply stepping away.
Each row of a footprint candle shows sell volume × buy volume at one price. A strong buy imbalance — ask volume three or more times the bid volume diagonally — marks real demand. Several imbalances stacked on top of each other often become support on a retest.
Delta is buy volume minus sell volume for a bar. Cumulative volume delta (CVD) adds it up through the session. When Nifty makes a new high but CVD does not, buyers are getting weaker — a divergence worth watching near a call wall or the day's value area high.
Absorption is heavy selling into a level that does not break: large bid volume on the footprint while the DOM ladder keeps refilling. The liquidity heatmap shows those resting orders over time, so you can tell a real wall from one that is pulled before price arrives.
Previous value area, POC, gamma flip and the biggest call and put walls.
Is delta confirming the move, or is price rising on falling CVD?
At a wall, does the footprint show stacked imbalances or trapped buyers?
Confirm with OI change and the option volume tape before acting.
Indices, stocks, option strikes and commodities, all with the same order flow tools.
Futures tape plus spot-tracked bars, with option flow folded in for the thinner contracts.
All 218 F&O stocks with their own order flow, and any individual option strike as its own chart.
13 front-month futures on the same tape, from 09:00 to the evening close.
No add-ons, no per-panel pricing. MCX and Flow AI are included.
The OptionAlgo dashboard has a free tier — Breakouts, Screen Lab, backtests and guides. Live analytics and Order Flow are for subscribers, using their own broker connection.
How order flow, delta and CVD work for each index, explained step by step.
Order Flow comes with the whole OptionAlgo analytics stack in one plan. Live data comes from your own broker connection.
Swipe the table to see every platform →
| Feature | OptionAlgo | GoCharting | NiftyTrader | Vtrender | FutPrint |
|---|---|---|---|---|---|
| Order flow | |||||
| Footprint (bid × ask) | |||||
| DOM / depth ladder | — | — | — | ||
| Liquidity heatmap | — | — | — | — | |
| Volume profile | POC & value area | ||||
| Market profile (TPO) | — | ||||
| Option chain & OI | — | ||||
| Gamma exposure (GEX) | — | Elite · indices | — | ||
| MCX commodities | Included | — | No | Max plan | |
| All F&O stocks (218) | All-F&O plan | Max plan | |||
| Plain-English AI on live flow | — | — | — | — | |
| Also in the same plan | |||||
| Options analytics dashboardAnalytics Pro, ₹999/mo on its own — GEX, PCR, max pain, OI, Greeks | Included | Premium plan | PCR & OI | — | |
| Option strategy builderStrategy Lab payoff & scenarios | Prime · extra | Payoff only | |||
| Strategy backtesting | Expired options | Options · extra | — | Options | |
| Stock breakout scanner | — | — | — | ||
| Fundamental screen backtestsScreen Lab | — | — | — | — | |
| Trading journal | — | — | — | — | |
| Free tier | Breakouts, backtests & guides | No footprint | 15-min delayed | End of day |
— = not listed in the feature review dated 1 Oct 2026. This table compares listed features only, not data quality, accuracy or results, and is not a recommendation of any platform. Plan coverage and availability can change. “Extra” means a separate paid plan. Product names are trademarks of their owners. OptionAlgo’s live data comes from each subscriber’s own broker connection; analytics are for information and education, not investment advice.
An order flow chart shows who traded at every price inside each candle: how much volume hit the bid (sellers) and how much lifted the ask (buyers). OptionAlgo builds it from the Nifty futures tape, so you see delta, cumulative delta (CVD), imbalances and absorption instead of only open-high-low-close.
Nifty, Bank Nifty, FinNifty and Sensex, all 218 F&O stocks, individual option strikes, and 13 MCX commodity futures including crude oil, natural gas, gold, silver and copper.
Yes, for subscribers. During market hours the footprint, delta, DOM ladder and charts update from live market data fetched through your own broker connection (OptionAlgo is not a market-data vendor). Outside market hours the last session stays on screen for review and replay.
Order Flow is ₹1,999 per month and includes every panel on this page, MCX commodities and Flow AI, plus everything in Analytics Pro (₹999 on its own): the options analytics dashboard, Strategy Lab, backtesting, the breakout scanner, Screen Lab and the trading journal. The main OptionAlgo dashboard has a free tier you can try first.
Yes. The app runs in any modern browser and has a phone layout with a bottom navigation rail, so footprint, DOM and the Flow AI work on mobile.
No. OptionAlgo is an analytics tool, not an investment adviser. It shows market data and derived metrics; trading decisions are your own.
Everything on this page — ₹1,999 a month, live through your own broker connection.